Statistical Analysis, (contin'd)
V. Autopsy
Autopsy information was available for 353 records: 256 subjects and 97 controls. For these 353 records, table 6 shows the association between case status and autopsy likelihood.
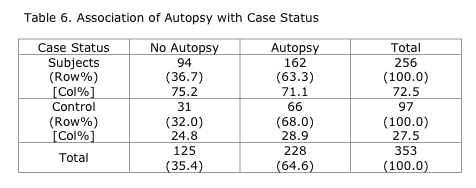
The "risk" (rate) of autopsy was 162/256=63.3% for subjects and 66/97=68% for controls. Thus subjects were about 87% as likely to be autopsied as controls. This difference is not statistically significant (p~0.20) but is suggestive of a difference (see section on cause of death below).
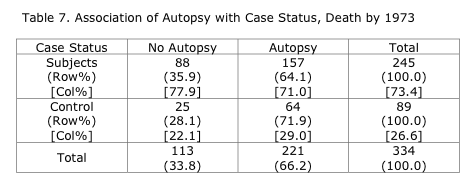
If we consider only men who were dead by 1973 (the end of the study), the rate of autopsy was 64.1% for subjects versus 71.9% for controls (p-value = 0.09), a result significant at p<0.10 and based on large enough numbers to be unlikely to be due to chance (Table 7).
VI. Cause of Death
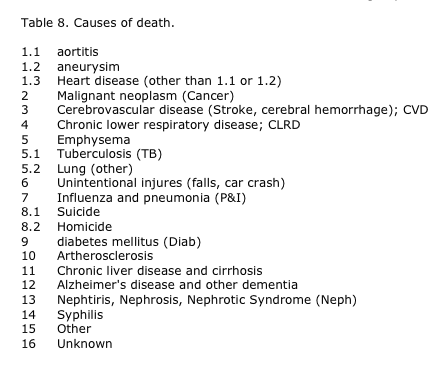
To investigate causes of death (COD), narrative cause of death information was grouped into causes corresponding to ICD5 categories (the ICD coding system used in the 1940s). For each record, the first cause of death recorded was used. Table 8 lists the COD groups.
Next is information on cause of death and infection status (Table 9. Here, C to S conversions are grouped with subjects (the results are not very different if the conversions are excluded). These data are not appropriate for assessing statistical significance (too many categories) but give a descriptive picture of potential associations. For example, aortitis, aneurism, and other heart disease are more prevalent causes of death among subjects than for controls.

Again, to investigate the effect of development of medical knowledge, cause of death by decade is given (1930-39, 1940-49, 1950-59, 1960-69, 1970-79). Table 10 presents the number of deaths for each cause in each decade by infection status.
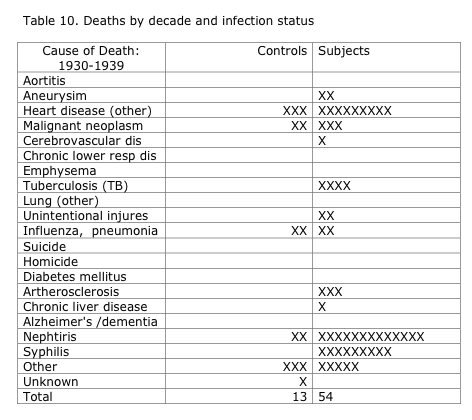
In the first decade (shown above), Subjects were more likely than controls to die of heart disease, nephritis, or syphilis.
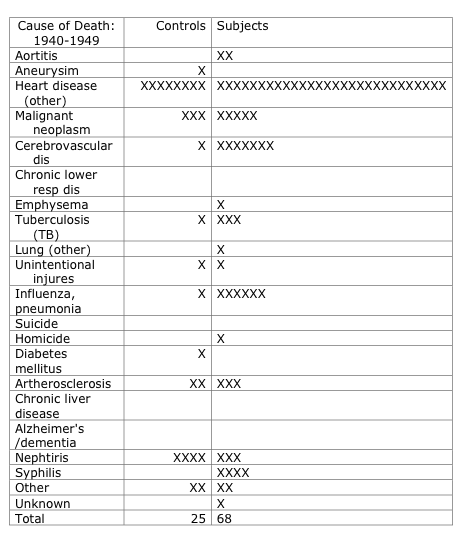
In the second decade (shown above), heart disease continued to dominate deaths in both groups, disproportionately subjects. Cerebrovascular disease and influenza were also higher in subjects.
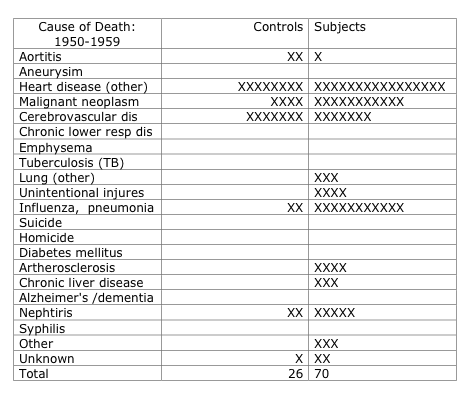
In the third decade (shown above), cancer, heart disease and influenza are disproportionately represented among subjects.
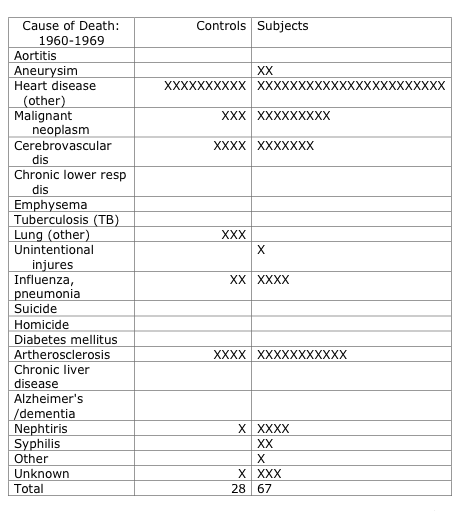
Heart disease, cancer, and artherosclerosis are predominant in the 4th decade.
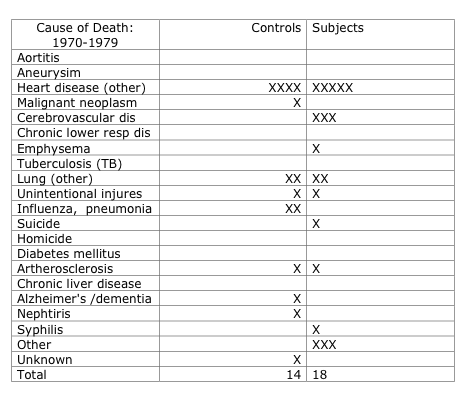
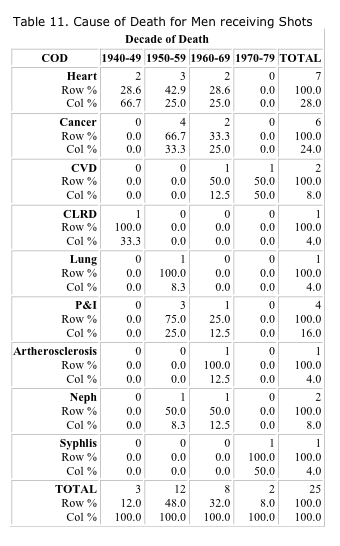
We considered causes of death for those syphilitic men who had received at least 10 shots during the study (Table 11). Although numbers are small (there are 39 such men; 25 of these have listed cause of death), there is statistical evidence of variation in causes of death over time (Chi-square = 33.8, p=0.09).
Return to prior data page.
Printer-friendly version of this Statistical Analysis (PDF)
